blueclaw ran an oil price query. Six tool calls, $0.11. I ran the same query again the next day. One tool call, $0.03. The output was the same. I had no idea why.
How to add observability to an AI agent (without a dashboard)
- Instrument at the tool boundary using
before_tool/after_toolhooks - Persist each run as structured JSON (one file per run)
- Query traces via CLI (
trace show,trace diff,trace timeline) - Add a lightweight local UI only when you need cross-run analysis
This gives you full visibility into agent behavior without external services, data leaving your machine, or infrastructure to maintain.
On paper that’s simple. In practice, I couldn’t explain what my agent was actually doing.
That was the failure mode I kept hitting: not crashes or obvious errors, but invisible differences in how the agent reasoned.
Runs that succeeded in unexpected ways. Failures I couldn’t reproduce. After one system prompt change, my agent started using a completely different tool sequence with no way to compare before and after.
Most observability tools hook at the API layer, which is too late. You need to instrument at the tool boundary, where the agent actually decides what to do.
I built blueclaw, an open source terminal AI agent (v2.0 on PyPI, built on the Strands Agents SDK) that I run daily for research and automation tasks. When I could no longer explain a run’s behavior from its output alone, I built the observability layer myself instead of reaching for a platform. This is what I built, why each piece exists, and what it actually changed.
I didn’t need a dashboard. I needed to see what my agent actually did.
Why I didn’t install a dashboard
I looked at the existing options briefly. Proxy-based tools only intercept the API call: they can’t see which tool the agent chose to invoke or why. Hosted platforms like LangSmith send your prompts to a third-party server, which is a non-starter if you’re running an agent against anything sensitive. Self-hosted options like Langfuse and Phoenix are solid, but they require a database and a container to be running. I didn’t want to maintain infrastructure just to debug a terminal agent on my laptop.
What I needed was simpler: a record of every tool call per run, queryable from the terminal. That’s a file, not a platform.
The Pattern: Hook → Persist → Query
The observability layer in blueclaw follows a simple loop:
Tool call fires
     |
     v
ObserverHooks captures step (tool, duration, input, output, error)
     |
     v
RunTrace written to .blueclaw/traces/YYYYMMDD-HHMMSS.json
     |
     v
CLI or local dashboard reads trace files on demand
Hook → Persist → Query. Instrument at the tool boundary. Write what happened to local storage. Query it in whatever form is useful.
Each step is independent. The hook doesn’t know about storage. Storage doesn’t know about the CLI. That made it easy to build incrementally: I shipped the hook first, added the CLI commands one at a time, and only built the browser dashboard when the terminal wasn’t enough.
Hook: instrument at the tool boundary
The Strands SDK exposes a HookProvider interface with BeforeToolCallEvent and AfterToolCallEvent callbacks. Every time the agent invokes a tool, these fire. That’s the right instrumentation point, not the API call but the tool call, which is where the agent’s decisions become visible. It’s the same reason APIs beat search for factual agent tasks: decisions happen at the tool boundary, not the model boundary.
I wrote ObserverHooks in observer.py. On every after_tool event, it records a TraceStep:
@dataclass
class TraceStep:
    index: int
    tool_name: str
    status: str               # "success" or "error"
    start_time: datetime
    end_time: datetime
    duration_ms: int
    input_summary: dict       # {key: truncated_value} per input field
    output_summary: str | None  # first 200 chars of tool output
    error: str | None
    tokens: int | None        # per-step attribution (v1.2+)
    cost: float | None        # per-step attribution (v1.2+)
Input and output are truncated to 200 characters. That’s enough to understand what happened in most cases, and it keeps trace files small. For outputs over 12,000 characters, the observer stores the head (8,000 chars) and tail (4,000 chars) with a truncation marker in between: you see the beginning and the end, which is where most failures are.
The hook also checks for user interrupt (Esc Esc) at each tool boundary. That’s a side benefit of hooking at this level: the agent can be cancelled cleanly between tool calls rather than mid-execution.
Persist: one JSON file per run
After the agent finishes, session.py assembles a RunTrace from the accumulated steps and writes it to disk:
{
  "run_id": "20260315-054426",
  "goal": "what is the current oil price",
  "model_id": "claude-sonnet-4-6",
  "status": "success",
  "total_tokens": 1840,
  "total_cost": 0.031,
  "context_strategy": "mask",
  "context_masked_chars": 2400,
  "steps": [
    {
      "index": 1,
      "tool_name": "web_search",
      "status": "success",
      "duration_ms": 412,
      "input_summary": {"query": "current oil price per barrel"},
      "output_summary": "Brent crude: $74.20/bbl as of March 15...",
      "error": null
    }
  ]
}
One file per run. Stored in .blueclaw/traces/. Auto-purged after 30 days (configurable in blueclaw.yaml). No database, no schema migrations, no connection strings. The traces directory is just a folder of JSON files you can grep, pipe to jq, or feed to any other tool.
The RunTrace also captures context_masked_chars, meaning how many characters of old tool output were replaced with placeholders to keep the context window small. That turned out to be more useful than I expected.
Query: CLI commands that read trace files
With traces on disk, I built a set of CLI commands that read them and render output in the terminal.
blueclaw trace show <run_id>
A table of every step: tool name, status, duration, input summary. First thing I run when a result looks wrong.
% blueclaw trace show 20260328-153918

Run: 20260328-153918
Task: what is the current price of gold
Model: claude-haiku-4-5-20251001
Status: success
Time: 2026-03-28 15:39:18 → 15:39:25
Context: mask

#    ┃ Tool            ┃   Duration ┃ Status
━━━━━╇━━━━━━━━━━━━━━━━━╇━━━━━━━━━━━━╇━━━━━━━━━
1    │ web_search      │     1849ms │ success
2    │ web_search      │     1916ms │ success
3    │ web_search      │     2069ms │ success
4    │ web_search      │     2529ms │ success
5    │ web_search      │     3579ms │ success

Total: 5 steps · 11942ms · 39025 tokens · $0.0334
blueclaw trace graph <run_id>
A tree view of the tool sequence, useful for seeing the shape of a run at a glance:
% blueclaw trace graph 20260328-153918

what is the current price of gold
├── web_search (1849ms) ✓  query: gold price APMEX Kitco today
├── web_search (1916ms) ✓  query: spot price gold current live
├── web_search (2069ms) ✓  query: gold price today USD per ounce
├── web_search (2529ms) ✓  query: gold spot price March 28 2026
└── web_search (3579ms) ✓  query: troy ounce gold price USD 2026
blueclaw trace timeline <run_id>
A waterfall chart showing each step’s start offset and duration relative to total wall time. This is how I found my first real bottleneck: one http_request step was taking 80% of wall time on every run. The step succeeded every time, so it never appeared in errors. The timeline made it immediately visible.
% blueclaw trace timeline 20260319-132443

Goal: search for "django 5.2 new features changelog" and fetch the official page
Model: claude-haiku-4-5-20251001 · 4 steps ·83080 tokens · $0.0690

#    ┃ Tool         ┃     Start ┃  Duration ┃ Cumulative ┃ Bar
━━━━━╇━━━━━━━━━━━━━━╇━━━━━━━━━━━╇━━━━━━━━━━━╇━━━━━━━━━━━━╇━━━━━━━━━━━━━━━━━━━━━
1    │ web_search   │  +1456ms  │   2047ms  │    2047ms  │ ████████████████████
2    │ http_request │ +17153ms  │    227ms  │    2274ms  │ ████
3    │ web_search   │ +20276ms  │   1543ms  │    3817ms  │ ███████████████
4    │ http_request │ +27393ms  │    379ms  │    4196ms  │ ███████

Tool time: 4196ms · Wall time: 30591ms · Overhead: 26395ms (86%)
blueclaw trace diff <run_id_1> <run_id_2>
Side-by-side comparison of two runs: steps, tokens, cost, duration delta. This became the most valuable command once I started iterating on prompts.
After a system prompt change that seemed minor, I ran trace diff on a before and after. The tool sequence was completely different. Same goal, different reasoning path, 40% more tokens. Without the diff, I would have shipped that change assuming it was safe because the final output looked similar. This is the silent failure pattern I covered in AI agent error handling patterns: agents that appear to work correctly but are failing in ways you can’t see.
% blueclaw trace diff 20260319-132515 20260319-132443

Run A: 20260319-132515
Run B: 20260319-132443

Goal A: based on all findings, recommend which python web
        framework to use for a new REST API project
Goal B: search for "django 5.2 new features changelog"
        and fetch the official page

Steps:  0 → 4 (+4)
Tokens: 98922 → 83080 (-15842)
Cost:   $0.0820 → $0.0690
Time:   0ms → 4196ms (+4196ms)
This example shows the diff format; in practice you’d compare two runs of the same goal.
blueclaw trace replay <run_id>
Interactive step-through: press Enter to advance through each step and inspect the full input and output. There’s also a --stub-tools mode that replays the run using recorded outputs instead of re-executing the real tools, useful for understanding the agent’s logic without side effects.
What observability actually changed
The oil price discrepancy turned out to be the lessons system working correctly. blueclaw scans the last 50 traces for goals similar to the current one (using Jaccard similarity on tokenized goal text) and injects brief behavioral hints. On the second run, it injected: “Previous similar task used 6 tool calls. Try to be more direct.”
One hint. Six tool calls became one. Cost dropped from $0.11 to $0.03.
I wouldn’t have known any of that without traces. The output was the same. There was nothing in the terminal to indicate the behavior had changed. The trace showed me the full reasoning path, and trace diff let me compare both runs side by side.
Three things changed in practice once I could see traces:
Bottleneck visibility. The trace timeline command surfaced a slow http_request step that was blocking every run. I added a timeout. Average run time dropped by a third.
Regression detection. After every prompt change, trace diff became a standard check. Step count, total tokens, and tool sequence are all visible at a glance. Regressions that were previously invisible are now obvious before they reach production.
Cost attribution via context masking. The context_masked_chars field in each trace shows how many characters of old tool output were replaced with placeholders. When I see that number spike unexpectedly, it usually means the agent is looping or the context is growing in a way I didn’t anticipate. It’s a cheap early signal for “something is going wrong” that shows up before it appears in cost.
When the CLI wasn’t enough
After a few weeks, I wanted trends across runs, not just individual traces. How many runs succeeded last week? Which tools were slowest on average? What did total daily cost look like?
I added blueclaw trace ui: a local Starlette server on port 8111 that serves a single-file vanilla JS dashboard. Four views: trace list, trace detail, run comparison, and aggregate stats.
blueclaw trace ui
# Serving at http://localhost:8111
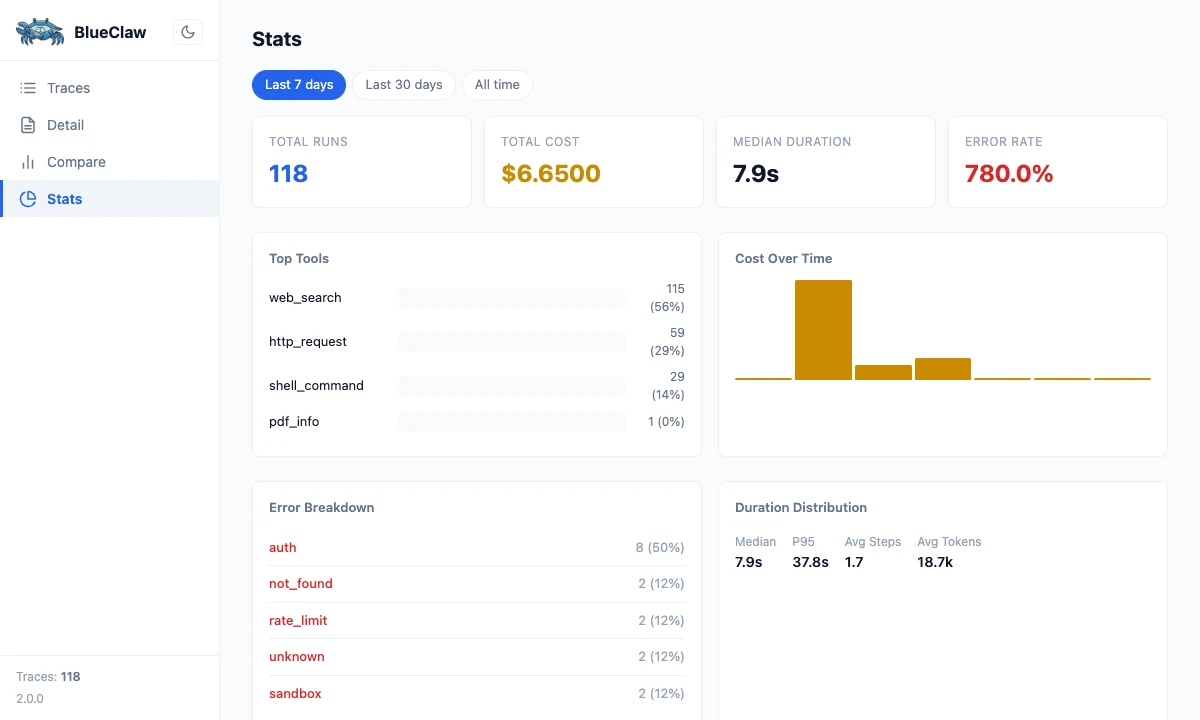
The detail I’m glad I noticed: Starlette and uvicorn were already in the dependency tree via strands-agents, so no new packages were needed at install time. The entire dashboard is a single HTML file: no build step, no Node.js, no bundler. It polls for new traces every 10 seconds, which is enough for an interactive terminal workflow.
What I’d build earlier next time
Two things I’d add at v1.0:
Per-step token attribution. The RunTrace captures total tokens for the full run, but not how many tokens each tool call consumed. I added tokens and cost fields to TraceStep in v1.2 as a forward-compatible placeholder, and even having the schema there made me reason differently about cost. Some tool calls are expensive not because they’re slow, but because they generate large outputs that inflate the context for every subsequent step. You can’t see that without per-step attribution.
Context masking from the start. Replacing old tool outputs with short placeholders after a threshold (the default in blueclaw is 10 tool calls) halved per-run costs with no quality loss. I built it in v1.3, but the cost reduction was available from the beginning. I just couldn’t see it until I had traces to look at. Without traces, I was optimizing blind.
The minimum viable loop
Hook → Persist → Query is the minimum viable observability loop for a single-agent system. Instrument at the tool boundary, not the API call. Persist each run as a flat JSON file. Query with CLI commands for debugging; add a local UI when you need trends.
It costs nothing to run. Your prompts stay on your machine. You can grep a trace file, pipe it to jq, or load it into any analysis tool. When something breaks, you have a complete record of exactly what the agent did.
Once you can see what your agent did, the monitoring layer becomes much easier to design. The error patterns that were invisible before become findable. Most of what looks like a model problem turns out to be a tooling problem. This is discipline #4 in The Production AI Agent Playbook: monitor behavior, not just infrastructure.
The problem was never the model. You just couldn’t see what it was doing.
Want to try this yourself? blueclaw is on GitHub, and pip install blueclaw gets you the full observability layer.
blueclaw is open source. The observability layer lives in observer.py, models.py, workspace.py, and web.py. The trace CLI commands are documented in docs/tracing.md.