
AI systems fail in two opposite directions. Deterministic software cannot make a semantic judgment. An LLM cannot produce an exact measurement. Most tools are built as if only one of those limits exists, and they cover the other by guessing.
Charts are where this shows up most clearly. Point a vision model at a line chart inside a PDF and ask for the Q3 value, and it might answer 4.2 with total confidence when the real value was 3.8, a number that appears nowhere as text. The model did not read the chart. It looked at a picture of one and estimated, the way you would squint at a slide from the back of a room. That is fine for a lot of tasks. When a person is going to act on the number, it is a wrong answer that sounds exactly like a right one.
I ship pdf-mcp, an open-source MCP server for large-PDF workflows that I use daily through Claude Desktop and Claude Code. One of its tools, pdf_extract_chart, pulls exact (x, y) tables out of born-digital charts. Plenty of tools read geometry instead of pixels. The part worth writing about is what this one does when reading geometry is not enough: instead of guessing, it turns around and asks the LLM that called it.
TL;DR: A deterministic server can read exact chart values from a PDF’s drawing commands but cannot always tell which curve belongs to which axis. An LLM can settle that in a glance but cannot read a precise value.
pdf_extract_chartsplits the work along that seam, a shape I call the delegated-judgment pattern: the server owns every number, and the few truly ambiguous choices get handed back to the model as closed questions. Neither party is ever asked to do the other’s job.
Two tools, two blind spots
A born-digital chart is not a picture. The PDF holds the actual drawing commands: stroke a line through these points, place this tick label here, fill this rectangle. The (x, y) data is right there in device coordinates. To recover real values you read the plotted geometry and calibrate it against the tick-label text: three or more ticks fix the mapping from device space to data units, and every point on the curve rides that mapping. Nothing is estimated.
So on the one job vision models get handed here, producing a value, the server can recover something vision cannot guarantee: an exact measurement. But the server has its own blind spot, and it is not small. Geometry alone cannot always answer:
- On a dual-axis chart, does this curve belong to the left axis or the right? Both calibrations are valid. The drawing does not say.
- Is this panel a line chart, a bar chart, a scatter plot, or a decorative flourish that happens to contain strokes?
- Is that tick label
10⁻⁶or10⁶? Some renderers draw the minus as a thin rule, invisible to text extraction. Miss it and the axis is off by twelve orders of magnitude, so the drawing has to be inspected, not just the text.
A person settles each of these in half a second by looking, and a vision model is good at the same kind of question. It is bad at reading 3.8 off a curve. The server has the opposite profile.
The inversion: a tool that asks its caller
Almost every MCP server is a one-way street. The LLM is the brain and the server is a tool it reaches for: a call goes down, data comes back up, and the tool answers questions without ever asking one. A normal tool call has two possible endings: here is your data, or here is an error.
pdf_extract_chart has a third ending: here is a question. When it hits an ambiguity it cannot settle from the drawing, it does not guess and it does not error out. It reaches back up the wire, holds a picture in front of the model, and asks it to look. For that one turn the roles invert: the server is asking, and the LLM, the thing that called it, is answering. The answer comes back down and the server finishes the job with it. The function call has become a conversation, and the server is running it.
Under that inversion sits a deterministic core the tool will never compromise, and around it the tool delegates only the decisions it cannot make honestly. For each ambiguity it walks a ladder, cheapest and most certain first:
for each ambiguous curve, try in order:

  1. geometry     pairings are usually unambiguous from
                  the drawing alone.    -> resolved_by: geometry
  2. text         match the curve color to an in-panel
                  legend or axis title. -> resolved_by: text
  3. ask the LLM  return a closed-enum question plus a
                  highlighted render.   -> resolved_by: hint
  4. decline      nothing resolved it? refuse with a
                  reason, return a render. -> status: declined
Rungs one and two are the server answering its own question whenever it honestly can. Rung three is the inversion in action. Rung four is the discipline that keeps the whole thing trustworthy, and I will come back to it.
A round-trip, concretely
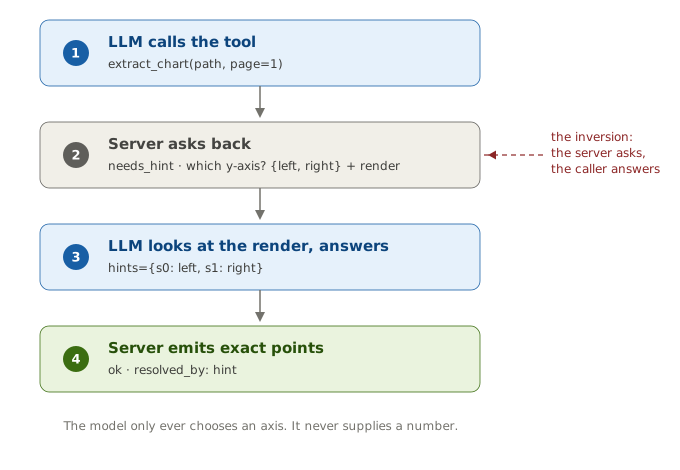
Take a dual-axis chart whose two curves cannot be assigned to an axis from geometry or legend text. The first call does not return data. It returns a question:
pdf_extract_chart("/path/to/dual_axis.pdf", page=1)
# status: "needs_hint"
# charts[0].series[0]: {color: [0.12, 0.47, 0.71],
#                       axis: null, resolved_by: null,
#                       pending_question: "p0.s0.axis"}
# charts[0].series[1]: {color: [0.84, 0.15, 0.16],
#                       axis: null, resolved_by: null,
#                       pending_question: "p0.s1.axis"}
# questions: [
#   {id: "p0.s0.axis", options: ["left", "right"],
#    highlight: "orange", render_path: ".../hints_p0.png"},
#   {id: "p0.s1.axis", options: ["left", "right"],
#    highlight: "cyan",   render_path: ".../hints_p0.png"},
# ]
Notice what is missing: neither series carries a points table. The tool never emits numbers calibrated against a guessed axis, so until the axis is settled there is nothing to hand back. Alongside the response comes an inlined image, the panel with the two curves haloed orange and cyan, so the model can see exactly which series each question is about.
The model looks, sees which curve hugs which axis, and answers, resending both hints together:
pdf_extract_chart(
    "/path/to/dual_axis.pdf", page=1,
    hints={"p0.s0.axis": "left", "p0.s1.axis": "right"},
)
# status: "ok"
# each series now carries resolved_by: "hint" and its points,
# calibrated against the axis the model picked.
Now the exact values flow. The model made the one call it was equipped to make, the server did the arithmetic it was equipped to do. (One sharp edge: hints never accumulate server-side. Each call is independent, so a follow-up must resend every answer gathered so far, not just the newest.)
Why it asks for a choice, never a number
This is the decision the whole tool turns on. A hint is a closed-enum semantic answer. It is never a value. The model may answer "left" or "right". It may never answer "3.8".
The reason is a guarantee about failure modes. Trace what a wrong hint can do. If the model mislabels the axis, the tool calibrates the curve against the other axis and you get a wrong pairing, which is visible and checkable. What it cannot do is invent a data point, because data points never come from the model. They come from geometry, always. The worst case of a bad hint is a mislabeled axis. The worst case of letting the model supply numbers is a fabricated dataset that looks exactly as authoritative as a real one.
That is the structural answer to why a confident-but-wrong LLM is the most dangerous kind: do not ask the confident party for the thing it will confidently fabricate.
The same seam runs through verification. Every emitted chart carries a verification_card: a small, falsifiable statement of what the server read, so the model can check it against the render in one glance. The coordinates are exact, but reading a tick label is still interpretation, so any reading the server is unsure of also carries a verify flag naming the exact thing to check before the value gets reported.
# verification_card on an emitted chart:
# x_axis: {scale: "linear", range: [0, 10],
#          ticks: [{raw: "0", value: 0}, {raw: "5", value: 5}, ...]}
# y_axis: {scale: "log", range: [1e-6, 1e0], ...}
# series: [{color_name: "red",  label: "training loss"},
#          {color_name: "blue", label: "val loss"}]
The model returns one more closed-enum verdict. It can null a mislabel or decline a chart it distrusts. It can never touch a coordinate, because coordinates were never the model’s to give.
Declining beats guessing
Rung four is where a tool is most tempted to cheat. When nothing resolves a chart, pdf_extract_chart declines, with a reason, and returns a render instead of a number. It declines on raster charts (pixels, no geometry to read). It declines when tick labels are drawn as vector outlines instead of real text, so the axis cannot be calibrated. It declines on crossing same-color curves it cannot untangle without risking stitching two lines into one. When a minus sign is drawn rather than typed, it reads the rule if the geometry is unambiguous and declines if it is not, because reading 10⁻⁶ as 10⁶ would be silently catastrophic.
Each of those is a spot where a vision-only reader emits a plausible number and moves on. Declining is the closed-enum principle taken to its end: if the tool cannot produce a value it can stand behind, it produces nothing and says why. A tool that refuses when unsure is worth more to an agent than one that is usually right, because the agent cannot tell a right answer from a wrong one at call time.
What the inversion bought
Without the handoff, the server would have to guess the axis and risk a mis-scaled series, or refuse every dual-axis plot and small-multiple grid, which are the figures most worth extracting. Asking lets it take on those hard charts without guessing.
The payoff shows up on real documents. The samples that drove this feature came straight from a reader’s request (issue #23): a Littelfuse diode datasheet and multi-panel figures from arXiv papers. These figures ship no source data, so “error” below is the gap between the tool’s value and the same point read by eye off a high-magnification render of the chart, checked point-for-point.
| Real-world target | Outcome | Error vs render-read value |
|---|---|---|
| Littelfuse datasheet, capacitance curve | Read from geometry | 1.3% |
| arXiv six-panel figure, one series | Read via axis hint | 0.7% |
| Log-log axis with only two tick labels | Declined, needs 3+ ticks | n/a |
| Plot of hundreds of crossing curves | Declined, cannot untangle | n/a |
Getting there was not clean. Along the way the tool emitted a German-locale test axis 1000× off, and on a sweep of 595 real panels it read several log axes as linear, including five astronomy plots whose minus signs were drawn. Each of those became a permanent decline rule and a regression case. On the current suite, 20 synthetic panels and 14 real figures, it emits zero mis-scaled or fabricated series. It reads what it can stand behind to within a percent, asks when it needs a human-level glance, and stays silent on the rest. That last property, not the accuracy, is what makes it safe to hand an agent.
The delegated-judgment pattern
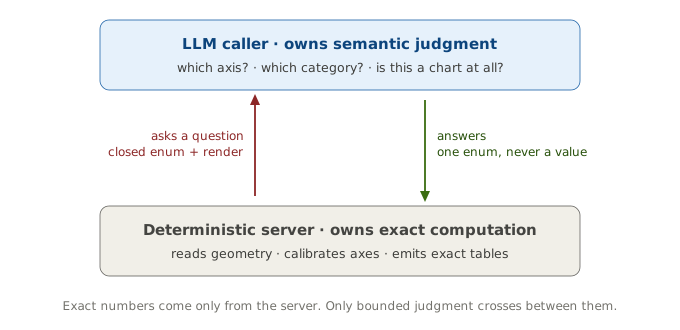
Strip away the PDFs and the charts and what is left is a shape you can lift into any MCP tool. Call it the delegated-judgment pattern:
- Find the deterministic core and make it authoritative. Whatever the server can compute exactly, it owns completely, and nothing fallible is allowed to overwrite it.
- Name the judgment calls the core cannot make honestly. They are usually semantic: which category, which owner, which of several valid readings. Do not paper over them with a heuristic that is right most of the time.
- Hand those calls back to the LLM as a closed choice. Give it the evidence to decide (here, a highlighted render) and constrain the answer to an enum, so a wrong answer is recoverable and can never corrupt the core.
- Decline when no path resolves it. Silence with a reason beats a confident fabrication.
The instinct with agent tools is to make the server as capable as possible so the model has to think less. Delegated judgment inverts that. The server deliberately does less than it could wherever doing more would mean guessing, and the model does the handful of things only it can do. Chart extraction is one case of it; the patterns that survived production collect the rest.
pdf_extract_chart ships in pdf-mcp. Point it at a chart it cannot read and it will tell you so, with a reason and a render you can read yourself.